好歌分享:教練 傑利 - 下雨的午後
前言
Q2 的時候稍微玩了一下 WebVR,主要是瞭解了 Mozilla 主導推出的 A-Frame,驚訝於其簡單方便的 API 設計外,也一直在想還能做什麼有趣的應用,直到最近在構思 D3 的一些範例時, 才突然又再想起 WebVR:既然 A-Frame 提供了一系列的 VR DOM object,而 D3.js 又能操作 DOM,那理論上一起使用是沒有問題的。
果不其然,稍稍在網路搜尋一下就看到 WSJ 的這篇 Is the Nasdaq in Another Bubble?
超酷的呀,視覺化股票歷史資料,做成雲霄飛車般的閱讀體驗,雖然我個人覺得資料視覺化應該要以宏觀角度來讓他人清楚了解整個脈絡,VR 的「個人」視角,限制了這部分的特性,但若以 Story telling 的角度來看,VR 加上數據視覺化反倒為使用者帶來更豐富生動的閱讀經驗,不僅僅是瞭解內容,過程有趣才能在碎片資訊爆炸的時代抓住人們的眼球!
在這個想法下就決定來嘗試看看用 A-Frame 與 D3 來製作資料視覺化,雖然還沒辦法做出太絢麗的互動體驗,但出發總要有個開始,就先試試最簡單的 Bar Chart 吧!
最後會長這樣:

前置作業
有摸過 A-Frame 的讀者應該很清楚要建立出一個 VR 場景有多簡單: 沒摸過的也歡迎回去看這篇 WebVR 101
See the Pen WebVR-D3-I by Arvin (@arvin0731) on CodePen.
加入 D3
回想一下,一般在使用 D3 的時候,就是選取出你要操作的 svg 元件,接著將進入 enter() 狀態的資料 append 上去,然後調整 Style 與 attributes。
那在 A-Frame 當中我們也可以如法泡製:
// 就像是以前選取 svg 一樣,只是在 VR 中我們要選取 a-scene
const scene = d3.select('a-scene');

// 處理資料與 DOM 元素的方式與平時操作 d3 相同,一樣的 enter/update/exit 狀態
const bars = scene.selectAll('a-box.bar').data(data);
// 真正 append 資料並設定屬性
bars.enter().append('a-box').classed('bar', true)
  .attr('position', (d, i) => {
  const x =  i * 0.8 - (data.length / 2);
  const y = hscale(d)/2;
  const z = -3
  return x + " " + y + " " + z
})
  .attr('width', (d) => 0.5)
  .attr('depth', (d) => 0.5)
  // hscale 就只是個 d3 的 scaleLinear 映射函數
  .attr('height', (d) => hscale(d))
  .attr('opacity', alpha)
  .attr('color', 'blue');
首先我們 select 出 a-scene,接著在其下面預先將資料 binding 到擁有 bar 這個 classname 的 a-box entity 內(此時還是虛擬的 DOM 物件),最後再呼叫 enter() 來真正的將資料 append 到 DOM 上面。
這邊有兩個小地方需要注意:
- 除了寬(width)與高(height)外,還有深度(depth)需要設定,畢竟現在是在 3D 的世界中。
- 數值的設定:在 WebVR API 中,回傳的距離資料以 Meter 為單位,因此在 A-frame 中的距離單位也是 Meter,並非一般頁面的 pixel,因此我們的 x, y, z 值記得不能設定太大。
結果如下:
See the Pen WebVR-D3-II by Arvin (@arvin0731) on CodePen.
簡單幾行 code 就能夠在 VR 的世界內呈現資料圖表囉!
互動元素
平面的 D3 能夠互動,VR 版當然也要。
在 VR 裡面的 Cursor 基本上是跟著你的攝影機(camera),你可以直接用 A-Frame 提供的 entity,就可以有基本的 gaze-based cursor(凝視型),顧名思義,也就是以你的視線為中心的 cursor,並且可以觸發 mouseenter, mouseleave 等事件:
<a-camera>
    <a-cursor></a-cursor>
</a-camera>
或是自己 create 一個 cursor entity:source
<a-entity position="0 1 0" rotation="0 0 0">
    <a-entity camera look-controls wasd-controls>
        <a-entity cursor="fuse: true; fuseTimeout: 500"
                position="0 0 -2"
                geometry="primitive: ring; radiusInner: 0.02; radiusOuter: 0.027"
                material="color: black; shader: flat">
        </a-entity>
    </a-entity>
</a-entity>
要注意的是,由於我們需要設定 cursor 與 camera 的位置,所以將這兩個 entity 都包在另一個 entity 下,並由最上層的 entity 來設定初始 position 會較為方便。
而在 cursor 這個 entity 上我們設定了幾個屬性:
- cursor:設定為 fuse: true,即代表 gaze-based cursor,會跟著你視線移動,並且當你「盯著」某個點一段時間(fuseTimeout)後,會觸發
Clickevent。 - material:可以設定其顏色材質。
- geometry:設定其物理形狀。
當然如果你是用 Vive, daydream 的 controller,也已有其相對應的 entity 可以使用,可以參考這份文件 (laser-controls)[https://aframe.io/docs/0.7.0/components/laser-controls.html]
設定好 cursor 後,接著就是在我們的 bar 上面設置 event listener 了。
在剛剛的 attr 後面再接著利用 on 來設定 listener:
bars.enter().append('a-box').classed('bar', true)
    .attr('position', (d, i) => {
        const x =  i * 0.8 - (data.length / 2);
        const y = hscale(d)/2;
        const z = -3;
        return x + " " + y + " " + z;
    })
    .attr('width', (d) => 0.5)
    .attr('depth', (d) => 0.5)
    .attr('height', (d) => hscale(d))
    .attr('opacity', alpha)
    .attr('color', 'blue')
    .on("mouseenter", function(d,i) {
        d3.select(this).transition().duration(10)
        .attr('opacity', 0.9);

        d3.select(this).append("a-text")
        .attr('color', 'red')
        .attr('align', 'center')
        .attr('position', `0 ${(hscale(d) / 2 + 0.5)} 0`)
        .attr('scale', '1 1 1')
        .attr('value', `${dataText[i]}, ${d}`);
    })
    .on("mouseleave", function(d,i) {
        d3.select(this).transition().duration(500)
        .attr('opacity', alpha);

        d3.select(this).select("a-text").remove();
    })
上面做的事情很簡單,在 mouseenter 時,我們 append 上一個 <a-text>,並設定顏色位置等等,然後套用一個 transition 動畫來改變 bar 的顏色,mouseleave 時把 style 還原。
如此一來你就有了一個可以互動的 VR bar chart 了!
See the Pen WebVR-D3-II by Arvin (@arvin0731) on CodePen.
Component 化
我做到這邊的時候突然有個想法,既然 A-frame 可以讓我們自己客製化 Entity 內要放的 component,那我們能不能將剛剛的 code 全部塞進 component 內呢?
還記得在 WebVR 101 中有記錄到我們可以透過 AFRAME 這個全域變數來註冊 component,並放入 <a-entity> 中:
reference
AFRAME.registerComponent('barchart', {
    schema: {
        json: {
            default: {
                    key: ['A', 'B', 'C', 'D', 'E'],
                    value: [19, 80, 30, 15, 55]
                }
            }
    },
    init: function () {
        this.generate();
    },

    generate: function () {
        const json = this.data.json;
        const el = this.el;
        // default alpha for bars
        const alpha = 0.6;
        const data = json.value;
        const dataText = json.key;
        // Select the current enity object just like an svg
        const currentEntity = d3.select(el);

        // we use d3's enter/update/exit pattern to draw and bind our dom elements
        const bars = currentEntity.selectAll('a-box.bar').data(data);
        /*
        ...
        這邊放入上面所撰寫的 D3 相關的程式碼
        */
    }
});- schema: 這邊是用來設定此 entity 的 properties,像是能透過設置 json 屬性來傳入資料
<a-entity barchart="json: data.json"></a-entity>。同時你也可以在這邊設定 default 的屬性值。 - init: Component 在初始階段會呼叫此函數一次,用來初始變數或是 component 的狀態,以我們這邊的例子就是用來呼叫 d3 繪製圖表。 (Component 還有許多 lifecycle:update, remove, tick, play, pause, updateSchema,可以參考官方文件)
- generate: 這邊就是我們用來處理 D3 圖表的函式。
在這邊比較需要了解的是 schema property 與 Component 本身的 HTML Element 的存取方式:
我們在 schema 中定義的屬性都會存在於 this.data 中,因此我們可以透過 this.data.json 來取得 json 屬性的資料;而 this.el 則是回傳 Component 本身的 HTML Element,我們要用來給 D3 進行 DOM object 操作的。
當你註冊好 component 後,在我們的 HTML 中就只需要放置 <a-entity barchart></a-entity> 就可以產生圖表了!
(唯一要注意的是,你的 component 一定要在 <a-sene> render 之前就處理好,最好是放在 <head> 的位置。
你之後只要將剛剛創建的 component export 出去,就可以讓任何人透過 <a-entity barchart></a-entity> 的方式來使用。
而且透過 property 的設定,我們可以傳入不同資料,甚至是顏色設定等等的屬性,來進行客製化的圖表!
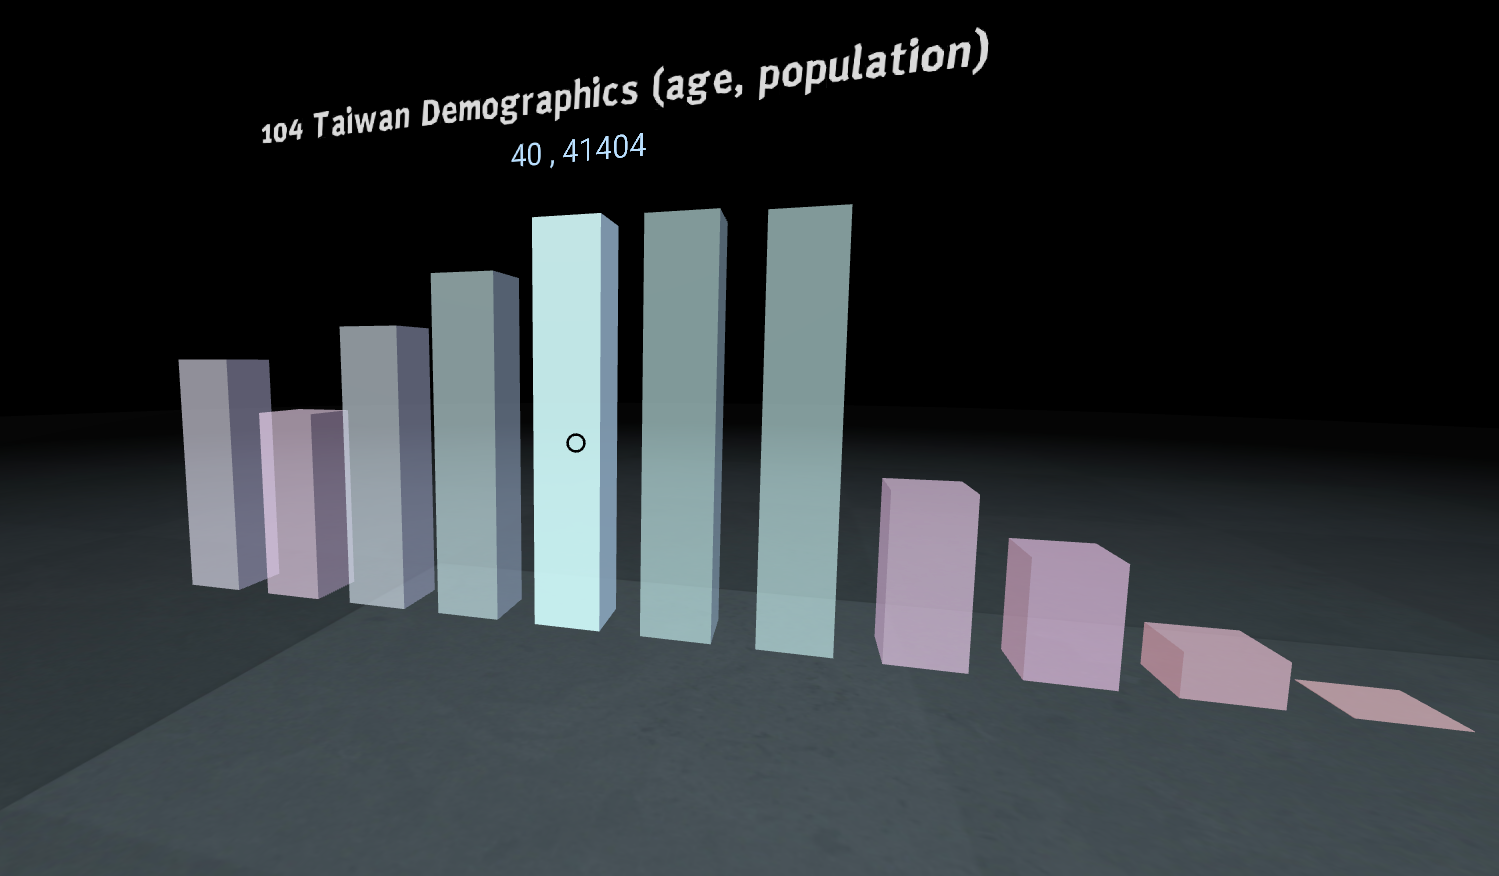
像是可以產生一個 104 年台灣年齡人口數統計長條圖:
只要在 html 中加入
<a-entity barchart="json: https://cdn.rawgit.com/ArvinH/f47671a9ff33b6719b043945d36054ac/raw/09a6ea23ee40d4a83205eef6d4fd4e5efa072c2b/104life.json"></a-entity>
稍微修改一下 component 內的 init 函數,因為從 entity 傳來的 property 預設會是 string 的 type:
init: function () {
    var self = this;
    if (typeof this.data.json === 'string') {
        fetch(this.data.json)
        .then(function(response) {
            return response.json();
        }).then(function(parsedJson) {
            self.generate(parsedJson || this.data.json); // fallback to default
        }).catch(function(ex) {
            console.log('parsing failed', ex)
        })
    }
},
順便加入一些 color 的處理,成果如下:
See the Pen WebVR-D3-IV by Arvin (@arvin0731) on CodePen.
結論
雖然只是簡單的實作一個 Barchart,但透過這次的小嘗試,大概了解該怎麼樣用 D3 與 A-Frame 寫出一個 WebVR Data visulization Component 後,就可以有許多東西可以玩了!或許可以結合現有的 3D modal,並將開放資料用不同的模型呈現,製作出一個 3D VR 版的城市圖表,應該會很有趣!加上他包裹成 Component 的方式非常方便,在社群的努力下,實作上勢必會更加輕鬆(github 上已經有許多人釋出的 component 可以使用)。
預計下一篇會再來做個有趣並複雜一點的 VR 資訊圖表!