『In theory, there is no difference between theory and practice. But, in practice, there is.』- Jan LA van de Snepscheut
前言
HTML 5 的 Canvas 是許多人做動畫、做遊戲常常會用到的工具,此外,如果是進行資料視覺化,在繪製大量的圖形與動畫時,Canvas 可以為你的 performance 帶來很大的改善,從 D3.js 實戰 - Canvas 把我的視覺化變「快」了! 中最後的範例就可以看得出來差異。
總之,身為前端工程師的我卻沒有實作做過 Canvas 相關應用,在羞愧之餘也得奮發向上扳回劣勢才可以,所以決定把上次用 d3 與 svg 繪製的颱風路徑圖重新用 Canvas 重寫一遍,也透過這篇文章做個紀錄。
Canvas 基礎概念 - 繪圖
Canvas 顧名思義就是一塊畫布,只不過是生存在你的 HTML DOM tree 中,讓你透過 Javascript 在上面揮灑創意。
Canvas 就像一般的 DOM 元素一樣,有 width 與 height 等屬性可以設定,也能透過 CSS 來操作他的樣式,而這些樣式並不會影響到你在上面所進行的任何繪製功能。
不過要注意一下,如果你是透過 CSS 去更改寬度與高度,他會放大 Canvas 元素本身,而不會放大 Canvas 內的像素,因此你在 Canvas 內繪製的圖形可能會變形。
<canvas id="worldMapCanvas" width="1000" height="600"> Your browser is too old... </canvas>
有了 Canvas 元素後,我們要取得他的 渲染環境(rendering context),之後必須要透過這個 Context 才能進行繪圖:
var canvas = document.getElementById('worldMapCanvas');
var ctx = canvas.getContext('2d');
接下來的一切繪圖操作就會跟著你取得的 context 進行,透過一連串 Canvas API,你可以繪製出如下的圖案:
See the Pen First demo - define graph by Arvin (@arvin0731) on CodePen.
在 ball.draw() 這個函數當中,我用了五個最基本的 Canvas API 來進行繪製:
    ctx.beginPath();
    ctx.arc(this.x, this.y, this.radius, 0, Math.PI * 2, true);
    ctx.closePath();
    ctx.fillStyle = this.color;
ctx.fill();-
ctx.beginPath(): MDN 上的說明是:產生一個新路徑,產生後再使用繪圖指令來設定路徑。 白話一點就是告訴 Canvas 說你現在要開始繪製線段了喔!請幫我開啟一個新的次路徑清單(sub-path),幫忙紀錄接下來我繪製的路線。 基本上在你每次繪製新的圖形或線段的時候,都需要呼叫一次beginPath(),否則 Canvas 會將你先前的繪製的部分與後續你想繪製的新圖型當作同一個連續的圖。 來個範例(沒有使用 beginPath() 就直接想繪製新圖形時):See the Pen First demo - beginPath by Arvin (@arvin0731) on CodePen.
可以發現我明明在
lineTo()後有設定不同的strokeStyle,但最後都被 #B90CB3 給取代了,這就是因為沒有呼叫 beginPath 來對線段做區隔。加上
beginPath()後,結果就會是我們想要的了:See the Pen First demo - addBeginPath by Arvin (@arvin0731) on CodePen.
-
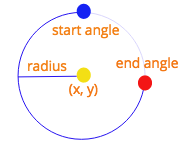
ctx.arc(x,y,raidus,startAngle,endAngle,counterclockwise): 就是畫出一個弧線,前兩個參數設定中心點的位置,接著設定半徑、起始點(起始角度)、結束點(結束角度)與方向(順時針或逆時針:
-
ctx.beginPath()的範例中還有用到moveTo(),lineTo()與stroke(),也都是很常用的 API,但從字面上就很好理解:- moveTo(x, y): 移動畫筆到 point x,y
- lineTo(x, y): 從現在畫筆位置畫一條直線到 point x,y(但光呼叫
lineTo()還不會畫出線段,需透過stroke()等相似 API) - stroke(): 實際下筆繪畫的 API
ctx.closePath(): closePath 其實在這邊不需要,他主要用途是在於幫你把你在 beginPath 後創建的 sub-path 做連接的動作,像是把第一條 path 的頭與最後一條 path 的尾巴接起來,但你也可以自己再多畫一條線將區域圍起來,只是稍嫌麻煩。 從字面上來看,closePath()很像是呼叫後就能幫你斷開路徑的連續性,保持後續繪製圖型的獨立性,但實際上沒有這個功用,你需要透過beginPath()來完成。
還有很多 canvas API 的介紹都可以在 MDN 上查詢到,有的教學附有中文呦!MDN Canvas tutorial
Canvas 基礎概念 - 動畫
先前利用 D3 與 svg 做動畫時,是使用 d3.timer 來控制時間,並且更改 svg 元素的 attribute 來移動物件,進而達到動畫效果,但是在 Canvas 的世界中,沒有移動的這種概念,你如果想要讓一個在 Canvas 上的物件移動,你需要的是重新繪製在不同位置的物件,在快速的 frame update 下,人眼看到的就會是一連串動畫了。這原理就跟一般的影片與動畫相同,都是透過每一次 frame 的更新,來呈現出連續畫面。
那要如何不斷地去更新 Canvas 呢?你可以透過 setInterval 也能夠用現在較為人知的 requestAnimationFrame 來處理,使用 setInterval 你可以直接控制動畫的更新速率,然而在效能上還是採用 requestAnimationFrame 較好,是以網頁頁面的更新速度為基準。
一個採用 requestAnimationFrame 的簡單動畫如下:
See the Pen First demo by Arvin (@arvin0731) on CodePen.
    ctx.clearRect(0,0, canvas.width, canvas.height);
    ball.draw();
    // ... calculate position

    raf = window.requestAnimationFrame(draw);
關鍵只有兩個地方:
- 在每次 requestAnimationFrame 執行時,你都要清空現在的 Canvas 畫面重新繪製
ctx.clearRect(0,0, canvas.width, canvas.height);。 - requestAnimationFrame 是必須自己去呼叫的,所以在我們的
draw()函式中,最後要自己呼叫 raf 來重新 trigger 自己的 draw function。 你可以像一般的 setInterval 一樣記錄他回傳的 reference,並在適當時間cancelAnimationFrame。
瞭解了 Canvas 的基礎知識後,可以開始動手今天的主題了!
由於範例是修改自 D3v4 工作坊 - React + D3 繪製 svg 動態路線地圖,所以關於資料的取得與格式請參考該篇或是下面 Demo 的程式碼。
地圖
在上一篇 D3v4 工作坊 - React + D3 繪製 svg 動態路線地圖 中,我們利用 svg path 元素搭配 d3.geoPath() 與 d3.geo 中的 geoMercator() 來繪製世界地圖,那 d3 有辦法幫助我們在 Canvas 上繪製世界圖嗎?
當然可以!
d3.geoPath() 有提供一個 context() API,讓你綁定 Canvas 的 context,然後就能傳入路徑資料繪製到 Canvas 上頭:
function renderMap() {
  const self = this;
  const canvasNode = d3Select('#mapCanvas').node();
  const context = canvasNode.getContext('2d');
  // 傳入 canvas context 給 geoPath()
  const path = geoPath().context(context);
  context.beginPath();
  // 記得一樣要放入你的映射函數
  path.projection(this.projection());
  this.state.worlddata.features.forEach((d, i) => {
      context.fillStyle =
        'rgba(38,50,56,'+ 1 / this.state.worlddata.features.length * i + ')'
      context.beginPath();
      // 綁定 Canvas context 的 path 就能將傳入的資料繪製在 Canvas 上頭
      path(d);
      context.fill();
  });

  // add graticules path
  context.beginPath();
  path.projection(this.projection());
  path(this.state.graticule);
  context.fillStyle = 'none';
  context.strokeStyle = '#79A09E';
  context.stroke();
  }
Demo: (可以切換模式看 code,或是到上一篇看,有許多重複的運算函式)
路徑
接著重頭戲是要畫上路徑,這邊會複雜許多,我盡力說明,但直接看 code 會清楚一點。
這邊說明在 Canvas 上繪製動態路線的原理與步驟:
線段動畫原理:
跟 svg 要製作動態路線一樣的原理,我們都是先將線畫好後,利用線段的 **line dash** 與 **dash offset** 來製作出路徑的動畫效果。(可參考 [上一篇](https://blog.arvinh.info/2017/07/21/d3-workshop-map/))因此在繪製上的步驟也差不多,只是實作的細節不同罷了:
- Step 1. 繪製線段的入口點:
既然一樣是利用 line dash 與 dash offset,那我們也就需要取得路徑的長度,才能夠設定 lineDash 麻,但是你如果在前面的範例中有打開過 devTool,就知道根本看不到 Canvas 上面你繪製的物件,每個線段也都是用各點的 x, y 值去連接,這樣要怎麼知道整個線段長呢?!
難道要每一段每一段的線長度加總起來嗎?或許是個方法,但太麻煩了!
我們可以直接利用 D3 創建一個 invisiablePath,然後透過 getTotalLength() 來取得線段長度,並利用在 Canvas 上頭!
renderLine() 是一切的起點,我們在這邊創建隱藏的 svg path 好計算長度,並呼叫 requestAnimationFrame 進行 loop,傳入 updateLine 函式來產生動畫。
renderLine(canvasCtx, typhoonPath, marker, typhoonId) {
    const pathCoordinates = [];
    typhoonPath.forEach((path) => {
        pathCoordinates.push({
            x: this.projection()(path.coordinates)[0],
            y: this.projection()(path.coordinates)[1],
        });
    });
    const lineFunction = d3Line()
      .x((d) => d.x)
      .y((d) => d.y)
      .curve(curveCatmullRom);
    // use svg path to get length
    const invisiblePath = d3Select('svg')
      .append('g')
      .append('path')
      .attr('d', lineFunction(pathCoordinates))
      .attr('fill', 'none')
      .attr('stroke', 'none')
      .attr('class', 'invisiblePath');
    this.invisibleSVGPath[typhoonId] = invisiblePath.node();
    const length = this.invisibleSVGPath[typhoonId].getTotalLength();
    // this clears itself once the line is drawn
    this.lineInterval[typhoonId] = requestAnimationFrame(this.updateLine.bind(this, canvasCtx, typhoonPath, length, marker, typhoonId));
}- Step 3. 更新線段的函式:
在每一次 requestAnimationFrame trigger 的時候,我們都會呼叫 updateLine() 來重新 render canvas,主要進行幾個步驟:
defineLine(),定義線段,每一次的 loop 都需要重新繪製線段。 跳至 Step 4 看詳細實作- 計算目前
progress,也就是目前 line offset 要調整到何處,我們是定義一個變數this.speed與this.dir來控制線段繪製的方向與速度。每一次的 loop 都會增加this.progress的值,然後丟入this.moveDash()中來繪製線段的 line dash 與 line dash offset。 跳至 Step 5 看詳細實作 - 最後,每一次呼叫
updateLine時,我們都會檢查this.progress是否已經與線段長度相同,代表已經走完一次路線,需要重新開始,這時候我們就需要先將 canvas 清空:canvasCtx.clearRect(0,0,1000,600),表示將 canvasCtx 所持有的渲染環境從位置 (0,0) 開始對寬 1000 與高 600 的 canvas 清空。最後可以利用setTimoue()來延長一下路徑走完後的時間,讓他不要馬上就清空 canvas 重繪。
updateLine(canvasCtx, typhoonPath, length, marker, typhoonId) {
    // define the line
    this.defineLine(canvasCtx, typhoonPath, marker, typhoonId);
    this.progress[typhoonId] = this.progress[typhoonId] || 0;
    if (this.progress[typhoonId] < length) {
      this.progress[typhoonId] += this.speed;
      this.moveDash(canvasCtx, typhoonId, typhoonPath, length, marker, this.progress[typhoonId], this.dir);
      requestAnimationFrame(this.updateLine.bind(this, canvasCtx, typhoonPath, length, marker, typhoonId));
    } else {

      canvasCtx.clearRect(0, 0, 1000, 600);
      this.progress[typhoonId] = 0;
      setTimeout(() => requestAnimationFrame(this.updateLine.bind(this, canvasCtx, typhoonPath, 500, marker, typhoonId)), 1000);
    }
}- Step 4. 定義線段的函式:
defineLine(canvasCtx, typhoonPath, marker, typhoonId) {
  // define path
  canvasCtx.beginPath();
  // start point
  const startPoint = {
    x: this.projection()(marker.coordinates)[0],
    y: this.projection()(marker.coordinates)[1],
  };
  // 移動畫筆到起始點
  canvasCtx.moveTo(startPoint.x, startPoint.y);

  // 將路徑中的每個點與點之間用 lineTo() 連接起來
  typhoonPath.forEach((path) => {
      const x = this.projection()(path.coordinates)[0];
      const y = this.projection()(path.coordinates)[1];
      canvasCtx.lineTo(x, y);
  });
  // 設定 style
  canvasCtx.lineWidth = 2;
  canvasCtx.strokeStyle = 'rgba(53, 247, 14,0.7)';
}- Step 5. 實作更新 LineDash 的函式:
單純的 moveDash 很簡單,只要透過 setLineDash(),將線段長度傳入,定義好你的 line dash 要多長,接著我們利用 Step 3 中提到的 this.speed 與 this.dir 來計算出現在要將 lineDashOffset 設為多少。
這邊有個有趣的 API,globalCompositeOperation,它可以用來決定你目前的 canvas context 渲染環境中,每個新繪製的物件與其他舊有的物件之間的階層關係,像是我這邊設置的 destination-over 就代表 新繪製的圖形會被壓在舊的圖形下方,至於為什麼我這邊要設置這個參數呢?待會介紹颱風圈實作時你就知道了!更多關於 globalCompositionOperation 的介紹可以看 MDN globalCompositeOperation
moveDash = (canvasCtx, typhoonId, typhoonPath, length, marker, frac, dir = -1) => {
  // default direction right->left
  // 設定 line dash 為線段長
  canvasCtx.setLineDash([length]);
  // 利用 `this.progress (frac)` 來慢慢增加 line-dash offset,製作出線段動態
  canvasCtx.lineDashOffset = dir * (frac + length);
  canvasCtx.globalCompositeOperation = 'destination-over';
  canvasCtx.stroke();
}
到這裡為止,你已經創建出與上次相同的動態路線地圖,只是是採用 Canvas 實作,Demo:
暴風圈
當然不能單純只有線段,還是需要有個跟著線段跑的颱風才比較有 fu。
你可以會想說,那就每次 moveDash() 執行的時候,順便也繪製上一個圓形的暴風圈不就好了嗎?
接著就這麼做了:
moveDash = (canvasCtx, typhoonId, typhoonPath, length, marker, frac, dir = -1) => {
  // default direction right->left
  /* 原本繪製線段的部分 ... */
  // ...
  // ..
  // Move typhoon marker
  canvasCtx.beginPath();
  canvasCtx.setLineDash([0]);
  canvasCtx.lineDashOffset = 0;
  canvasCtx.lineWidth = 1;
  canvasCtx.strokeStyle = 'rgba(53, 247, 14,0.8)';
  canvasCtx.arc(p.x, p.y, 10, 0, Math.PI * 2, true);
  canvasCtx.closePath();
  canvasCtx.stroke();
}
然後就看到下面這個悲劇:
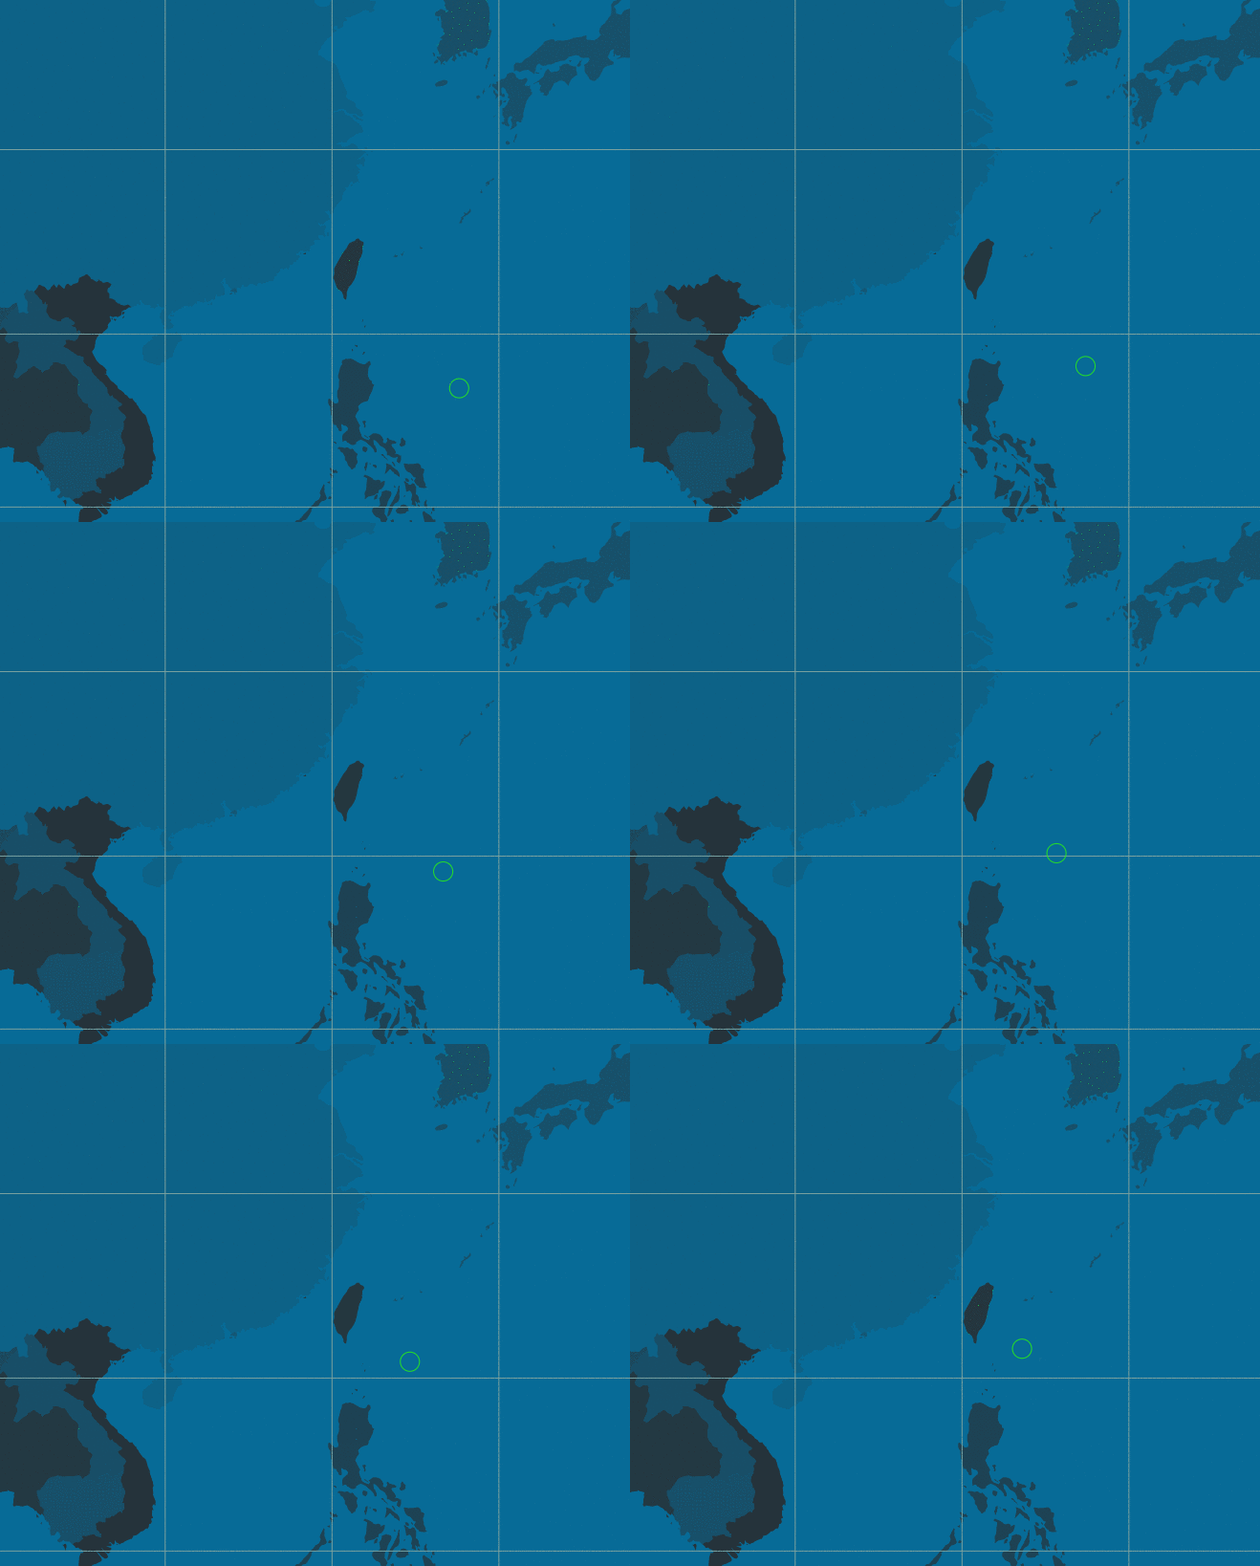
其實也沒有錯,你的確是畫上圈圈了,但是每一次的 moveDash() 都會畫上一個圈圈,並且會持續留在 Canvas 上,而實際上我們應該每一步都要將前一個圈圈刪除。
但如果你在這邊加上 canvasCtx.clearRect(0, 0, 1000, 600);,就會發現圈圈會正常移動了,但線段不見了...因為 moveDash() 並沒有重新繪製線段,只有更改 context 的 line dash。

解法
那就多畫一層 Canvas 吧!
沒有人說過 Canvas 只能有一層,你可以疊加一層 Canvas 上去,讓跟著線段移動的暴風圈獨自一個圖層,這樣一來就不會互相影響了!
moveDash = (canvasCtx, canvasTyphoonMarkerCtx, typhoonId, typhoonPath, length, marker, frac, dir = -1) => {
  // default direction right->left
  canvasCtx.setLineDash([length]);
  canvasCtx.lineDashOffset = dir * (frac + length);
  canvasCtx.globalCompositeOperation = 'destination-over';
  canvasCtx.stroke();
  const p = this.invisibleSVGPath[typhoonId].getPointAtLength(frac);
  canvasCtx.save();
  // Move typhoon marker
  canvasTyphoonMarkerCtx.clearRect(0, 0, 1000, 600);
  canvasTyphoonMarkerCtx.beginPath();
  canvasTyphoonMarkerCtx.setLineDash([0]);
  canvasTyphoonMarkerCtx.lineDashOffset = 0;
  canvasTyphoonMarkerCtx.lineWidth = 1;
  canvasTyphoonMarkerCtx.strokeStyle = 'rgba(53, 247, 14,0.8)';
  canvasTyphoonMarkerCtx.arc(p.x, p.y, 10, 0, Math.PI * 2, true);
  canvasTyphoonMarkerCtx.closePath();
  canvasTyphoonMarkerCtx.stroke();
}
const p = this.invisibleSVGPath[typhoonId].getPointAtLength(frac); 這邊我們先前創立的 invisibleSVGPath 又登場了,用來取得目前的線段點資料。
Demo: 利用兩層 Canvas 來實作跟著線段移動的暴風圈:
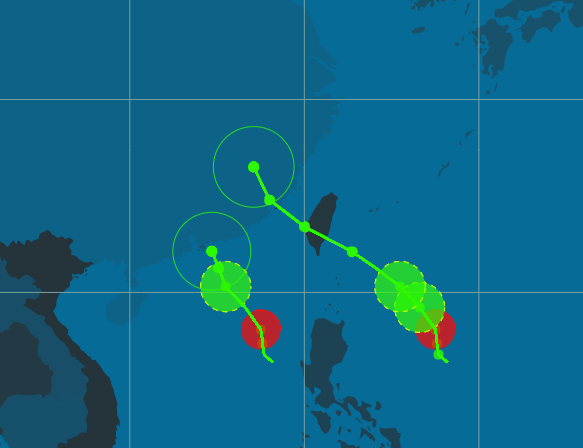
最後 Demo - 加上時間判斷、顏色區別、多個颱風的情況:
這邊還要注意一下,稍早提到的 globalCompositeOperation,如果你設為 source-over,也就是新繪製出的物件蓋在舊的上面的話,你就會發現颱風圈都被壓在線段下了!

因為在 moveDash 中,線段是一直在重新繪製的,而你留下的颱風圈相對就是舊的物件,所以記得要改成 destinatioin-over 才能有比較好的效果!
根據時間留下暴風圈
這實作方法很簡單,就是在 moveDash 中判斷該點的時間,若符合要求就繪製上一個圖案即可,有興趣的讀者可以直接從 code 中看到。
如何讓所有動畫都結束後才一起重播?
在我最後一個 Demo 中,一個颱風的路徑較短,一個較長,但卻能同時重播,我採用的方法其實蠻愚蠢的,暫時還沒想到更好的解法,歡迎大家提供。
我的方法是,用一個共有變數 this.allDone 來記錄每條路徑是否已經播完動畫(走完整條 path),接著在 updateLine() 中,當自己跑完 path 時,就會多檢查一下 this.allDone 中的結果,如果還有人在跑,那自己就繼續呼叫 requestAnimationFrame,但不將 Canvas 清空,所以會一直 loop 檢查 this.allDone,直到大家都跑完才清空 Canvas 並重新 loop。
if (this.progress[typhoonId] < length) {
   // 正常執行 defineLine 與 moveDash
} else {
  // 不斷檢查是否每條 path 都跑完了
  this.allDone[typhoonId] = true;
  let keepWaiting;
  Object.keys(this.allDone).forEach((allDoneTyphoonId) => {
    if (!this.allDone[allDoneTyphoonId]) {
        keepWaiting = true;
    }
    return keepWaiting;
  });
  if (keepWaiting) {
    requestAnimationFrame(this.updateLine.bind(this, canvasCtx, canvasTyphoonMarkerCtx, typhoonPath, 500, marker, typhoonId));
  } else {
    // 清空 canvas 並重新 loop
  }
}
結論
利用 Canvas 繪製動畫實際上比用 D3 + svg 煩瑣多了,但是當你的動畫有大量的物件時,Canvas 能為你帶來大幅的 performance 改進,畢竟 svg 的操作會直接影響到 DOM tree。 另外,實際上要將這些東西應用到 Production 的話,其實還有非常多細節要調整,包含各種 Browser 與 Device 的呈現、Map Scale 的彈性等等,還有很長的路要走啊... 這篇文章算是我的一個筆記,寫得有點雜亂,歡迎(有看完的或是看不下去的)讀者給予任何建議! (PS. 我本來路徑跟暴風圈的顏色是想弄得像 EVA 風格,結果有點慘XD 但我懶得修了就給大家笑笑~)